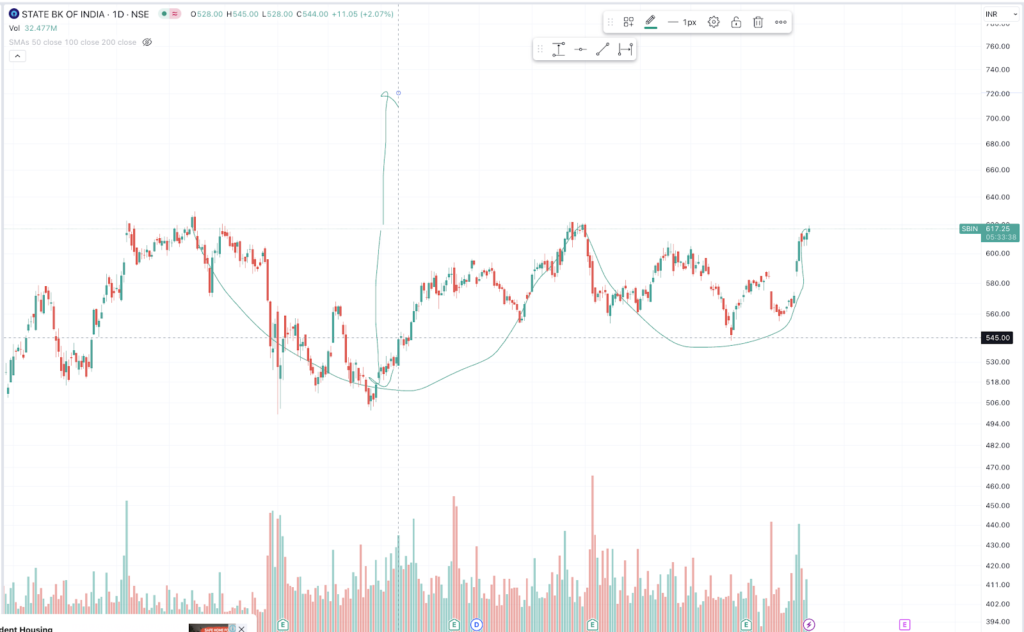
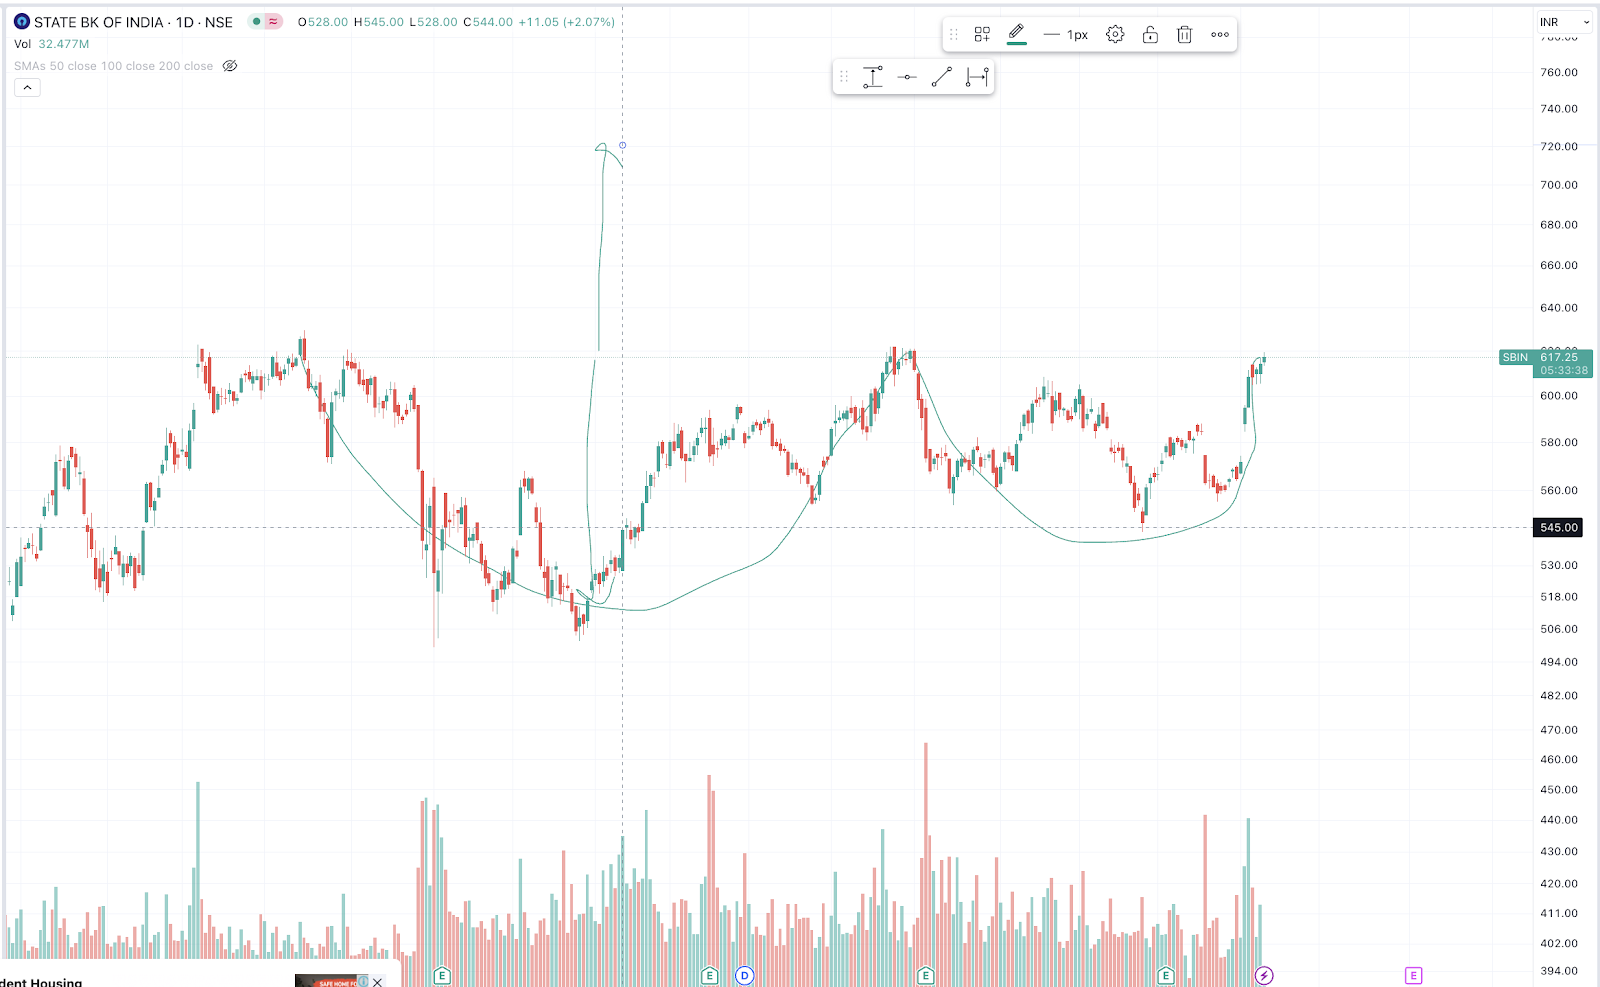
Here is the technical chart of SBI. Some strong technical patterns forming.
[1] The resistance of around 620 has been tested multiple times in the past. If the overall BANK NIFTY goes up from this point, likely that SBI will do well.
[2] The technical target of the stock come out to be around 720
[3] The results of the firm has been good: profit, revenues, NPAs all look decent. P/E is bottoming out as is quite reasonable.
[4] The only problem with the stock seems to be that we don’t know loan exposure to big players. But, this is unlikely to blow up before elections.
[5] So from a holding risk perspective:
a. Growth scenario: 20% gain (6 months)
b. Moderate scenario: 10-15% gain (in alignment with the results)
c. Worst case: no major stock fall; if even there is, likely to go back to 620 PS: Not a stock recommendation.